A Diagram is a visual representation of elements. Most of the time, we draw diagrams as connected graphs with vertices (representing ’things’) and arcs (representing relationships). To visualize a system, you can draw diagrams from different angles; they’re essentially projections of the system.
UML 2.0 provides 13 types of diagrams: Class Diagram, Object Diagram, Use Case Diagram, Sequence Diagram, Communication Diagram, State Diagram, Activity Diagram, Component Diagram, Composite Structure Diagram, Deployment Diagram, Package Diagram, Interaction Overview Diagram, and Timing Diagram. Sequence, Communication, Interaction Overview, and Timing diagrams are all known as Interaction Diagrams.
(I) Class Diagram
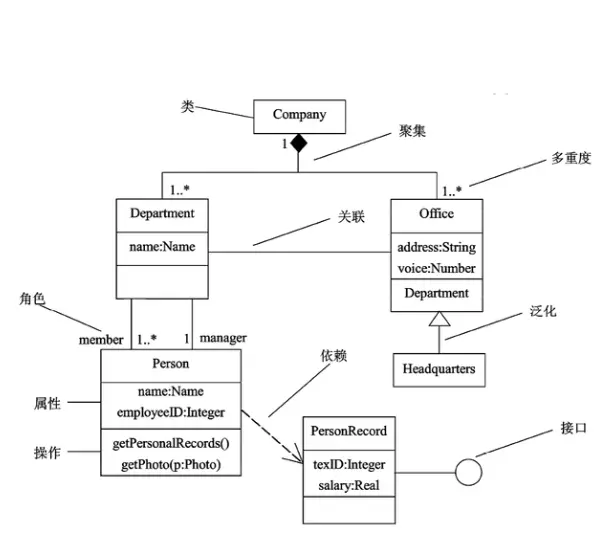
A Class Diagram shows a set of objects, interfaces, collaborations, and their relationships. It’s the most common diagram type for modeling object-oriented systems. Class diagrams give you a static design view of the system. If it includes active classes, it also provides a static process view.
Typically, a Class Diagram includes:
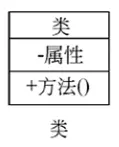
- Classes
- Interfaces
- Collaborations
- Dependency, Generalization, and Association relationships
For example:
| Student |
|---|
| +id: int -name: String #age: int |
| ~borrow(): bool |
+: public
-: private
#: protected
~: package
Class diagrams can also include notes and constraints. Plus, they can feature packages or subsystems, which help group model elements into larger chunks.
Class diagrams are used for modeling the system’s static design view. This view mainly supports the system’s functional requirements – the services it provides to end-users. When modeling a system’s static design view, class diagrams are typically used in one of three ways:
- Modeling the system’s vocabulary
- Modeling simple collaborations
- Modeling logical database schemas
(II) Object Diagram
An Object Diagram shows a set of objects and their relationships at a specific point in time. It’s essentially a static snapshot of instances defined in class diagrams. Object diagrams usually contain objects and links.
| ObjectName : ClassName |
|---|
| Attributes |
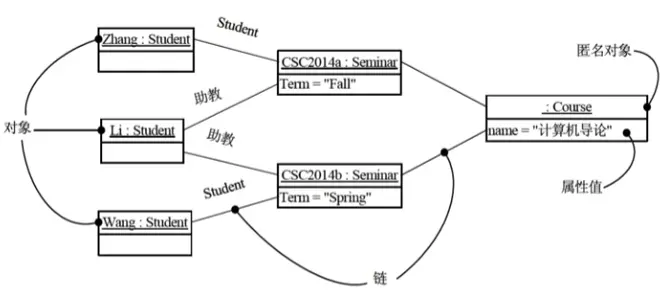
Like class diagrams, object diagrams provide a static design view or static process view of the system.
(III) Use Case Diagram
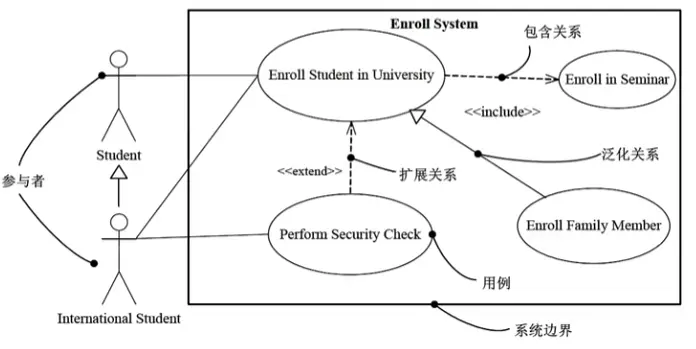
Use Case Diagrams show a set of use cases, actors, and their relationships.
Use case diagrams typically include:
- Use Cases
- Actors
<<extend>>and<<include>>relationships between use cases, association relationships between actors and use cases, and generalization relationships (between use cases, and between actors).
Include Relationship
One use case includes another.
Base Use Case –
<<include>>–> Included Use CaseExtend Relationship
When a use case runs, special or optional situations might pop up. These scenarios are considered ’extended’ use cases for the original.
Extended Use Case –
<<extend>>–> Base Use Case
Use case diagrams model the system’s static use case view. This view mainly covers system behavior – essentially, the externally visible services the system offers within its environment.
When modeling the system’s static use case view, use case diagrams can be used in two ways:
- Modeling the system’s context
- Modeling system requirements
(IV) Interaction Diagrams
Interaction diagrams model a system’s dynamic aspects. An interaction diagram shows an interaction: a set of objects, their relationships, and the messages they can exchange. These diagrams come as Sequence, Communication, Interaction Overview, and Timing diagrams. Each type serves a different purpose. Sequence diagrams highlight message timing. Communication diagrams focus on the structural arrangement of message-exchanging objects. Interaction overview diagrams emphasize control flow.
Interaction diagrams generally include objects, links, and messages.
Sequence Diagram
A Sequence Diagram is a visual representation of a scenario, detailing interactions between objects arranged chronologically. To build one, you put participating objects horizontally across the top. Usually, the initiator goes on the left, with subordinate objects to its right. Then, messages sent and received are stacked vertically, top-to-bottom, in time order. This gives you a clear visual trace of control flow as time progresses.
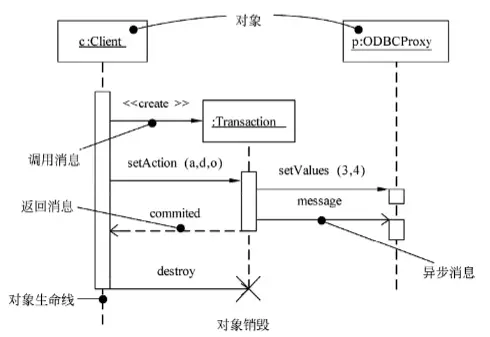
Sequence diagrams have two distinct features compared to communication diagrams:
- Sequence diagrams have object lifelines. An object lifeline is a vertical dashed line indicating an object’s existence over a period.
- Sequence diagrams have focus of control. A focus of control is a tall, narrow rectangle indicating the time period an object spends performing an action, either directly or through a subordinate procedure. The top of the rectangle marks the start of the action, and the bottom marks its end.
Communication Diagram
A Communication Diagram (formerly ‘Collaboration Diagram’) emphasizes the structural setup of objects sending and receiving messages. It focuses on how objects involved in an interaction are organized. To make one, you start with participating objects as diagram vertices. Then, links between these objects become arcs. Finally, you decorate these links with the messages objects send and receive. This gives a clear visual trace of control flow within the structural context of the collaborating objects.
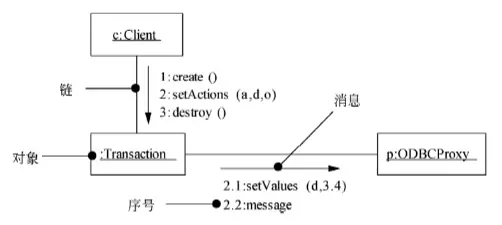
Communication diagrams have two distinct characteristics compared to sequence diagrams:
- Communication diagrams have paths. To show how one object links to another, you can attach a path stereotype to the end of a link.
- Communication diagrams have sequence numbers. To indicate the temporal order of a message, you can prefix it with a number. In the control flow, each new message’s sequence number increases monotonically. For nesting, use decimal-point numbers.
Sequence and communication diagrams are isomorphic and can be converted into each other.
(V) State Diagram
A State Diagram (or State Machine Diagram) shows a state machine, made up of states, transitions, events, and activities. State diagrams focus on a system’s dynamic view. They’re super important for modeling the behavior of interfaces, classes, and collaborations, highlighting the event-driven sequence of object actions.
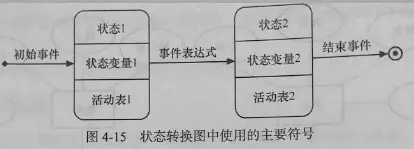
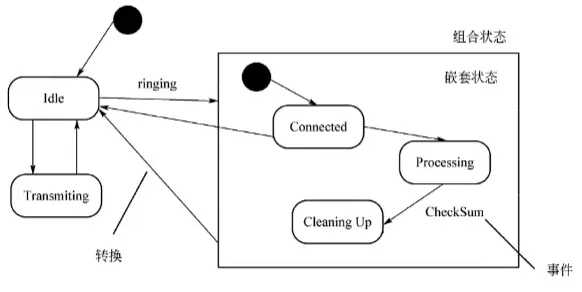
State diagrams typically include simple and composite states, as well as transitions (events and actions).
States
A state is any observable system behavior pattern; it represents a single behavioral mode. States dictate how a system reacts to events. A system might respond by performing an action (or several), simply changing its own state, or doing both.
In state diagrams, you’ll mainly find initial states, final states, and intermediate states. An initial state is a solid black dot. A final state is a black dot inside a circle. Regular states in a state diagram are rounded rectangles.
State transitions happen between states, shown by an arrowed line. The transition starts when the event on that arrowed line fires. A state diagram must have only one initial state, but it can have zero or many final states.
Three standard events:
- entry: Entry action, executed immediately upon entering the state.
- exit: Exit action, executed immediately upon exiting the state.
- do: Internal activity, occupies a finite time and can be interrupted.
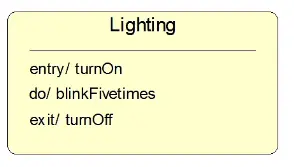
From the example above:
- entry/turnON: When transitioning to this state, perform the ’turn on light’ action.
- do/blinkFivetimes: While in this state, the light blinks 5 times.
- exit/turnOFF: When transitioning out of this state, perform the ’turn off light’ action.
Events and Transitions
An event is something that occurs at a specific moment. It’s an abstraction of an external trigger causing a system to act or (and) transition between states. Think of a viewer using a TV remote, or a user moving/clicking a mouse – those are events. Basically, an event is control info that makes the system act or change state.
State transitions are usually event-driven. When that’s the case, the event expression that triggers the transition should be labeled on the arrow representing the state change.
If an arrow lacks an event label, the transition triggers automatically once all internal activities of the source state are done. Here’s the syntax for an event expression:
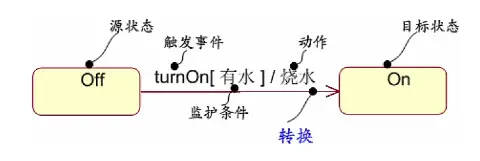
event-specification[guard-condition]/action-expression
Where the syntax for event-specification is: eventName(parameterList)
A guard condition is a Boolean expression. If you use both an event specification and a guard condition, the state transition fires only if the event occurs and the Boolean expression is true. If there’s just a guard condition without an event spec, the transition happens whenever that guard condition is true.
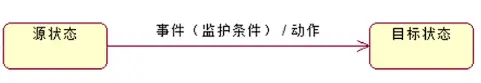
Transitions involve two states (source state, target state) Events, guard conditions, actions
Events trigger transitions
Activities (actions) can be performed within a state or during a state transition.
Complete Diagram
You can use state diagrams to model a system’s dynamic aspects. This includes the event-driven behavior of any object type present in the system’s architecture, like classes (especially active ones), interfaces, components, and nodes.
When modeling the dynamic aspects of a system, class, or use case, you typically model reactive objects.
(VI) Activity Diagram
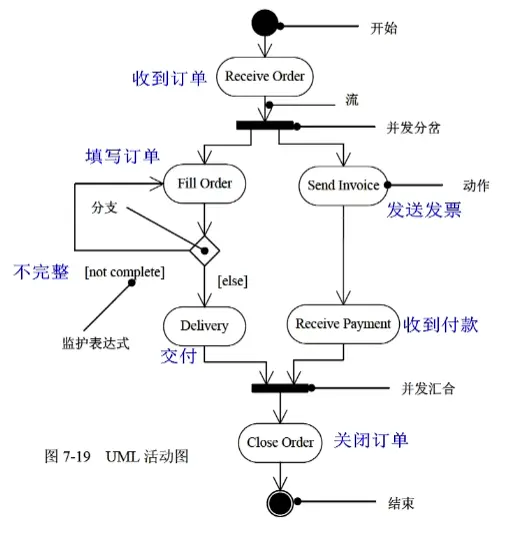
An Activity Diagram is a specialized state diagram that illustrates the flow from one activity to the next within a system. These diagrams zero in on a system’s dynamic view, are key for functional modeling, and highlight control flow between objects.
Activity diagrams generally include activity states and action states, transitions, and objects.
Activity diagrams can represent branches, merges, forks, and joins.
When modeling the dynamic aspects of a system, there are generally two ways to use activity diagrams:
- Modeling workflows
- Modeling operations
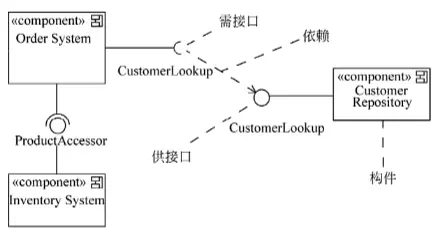
(VII) Component Diagram
A Component Diagram illustrates the organization and dependencies among a set of components. These diagrams focus on a system’s static implementation view. They’re related to class diagrams, with components often mapping to one or more classes, interfaces, or collaborations.
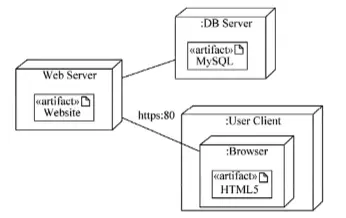
(VIII) Deployment Diagram
A Deployment Diagram models the physical aspects of an object-oriented system. It shows the configuration of runtime processing nodes and the components (artifacts) deployed on them. Deployment diagrams model the static deployment view and are linked to component diagrams. Usually, a node is a physical runtime element representing a computing resource. It has some content, often processing power, and contains one or more components. <<artifact>> here means an artifact.
Summary
- Static Modeling: Class Diagram, Object Diagram, Use Case Diagram
- Dynamic Modeling: Sequence Diagram, Communication Diagram, State Machine Diagram, Activity Diagram
- Physical Modeling: Component Diagram, Deployment Diagram
Interaction Diagrams: Sequence Diagram, Communication Diagram