Software Engineering Series - Article 5
Software projects fail a lot. Usually, it’s because project management is weak. Due to the unique nature and complexity of software, applying project management principles to the software engineering field gives us Software Project Management.
The Scope of Software Project Management
Effective software project management focuses on the “4 Ps”: People, Product, Process, and Project.
Software Project Estimation
Software project estimation involves many factors like people, technology, and environment. You need specific methods to back up your estimates. Here are three common ones:
- Estimating based on similar completed projects.
- Estimating based on decomposition techniques.
- Estimating based on empirical models. Typical examples include the IBM model, COCOMO model, and Putnam model.
You can mix these methods to improve accuracy.
COCOMO Estimation Model
The Constructive Cost Model (COCOMO) is a precise and widely used cost estimation model. It is divided into three levels of detail: Basic, Intermediate, and Detailed.
Basic COCOMO Model
Basic COCOMO is a static, single-variable model used to estimate the entire software system.
The formulas are:
Where E is effort (person-months); D is development time (months); L is the estimated thousands of source lines of code (KLOC), excluding comments and docs; and a, b, c, d are constants.
With Basic COCOMO, you estimate the code lines (L) first, then calculate the effort and time.
Intermediate COCOMO Model
Intermediate COCOMO is a static, multi-variable model. it treats the software system at two levels: system and component. It views effort as a function of program size and a set of “cost drivers.”
It builds on the Basic model but adds 15 factors affecting effort, using an Effort Adjustment Factor (EAF) to refine the estimate.
The formula is:
Where L is KLOC, and a and b are constants.
Detailed COCOMO Model
This model breaks things down into three levels: system, subsystem, and module. Besides Intermediate factors, it considers the impact of cost drivers at specific stages like requirements analysis and software design.
COCOMO II Model
The original COCOMO was huge in the industry, and it has evolved into COCOMO II. Like its predecessor, COCOMO II is a hierarchical model with three stages:
- Application Composition Model: Used in early stages for UI prototyping, system interaction, and performance/maturity assessment.
- Early Design Stage Model: Used once requirements are stable and the basic architecture is set.
- Post-Architecture Stage Model: Used during the actual construction of the software.
COCOMO II uses size estimates like Object Points, Function Points, or Lines of Code. Application Composition uses Object Points; Early Design uses Function Points (which can be converted to Lines of Code).
Schedule Management
The goal here is simple: make sure the project finishes on time.
Principles of Schedule Management
- Compartmentalization (Division)
- Interdependency
- Time Allocation
- Effort Validation
- Defined Responsibilities
- Defined Outcomes
- Defined Milestones
Scheduling Methods
Common visual tools include Gantt charts and PERT (Program Evaluation & Review Technique) charts.
Gantt Charts
A Gantt chart is a horizontal bar chart that tracks tasks against a calendar. The horizontal axis is time (days, weeks, etc.), and tasks are listed vertically on the left. Each bar shows a task’s start, end, and duration. Overlapping bars indicate concurrent tasks.
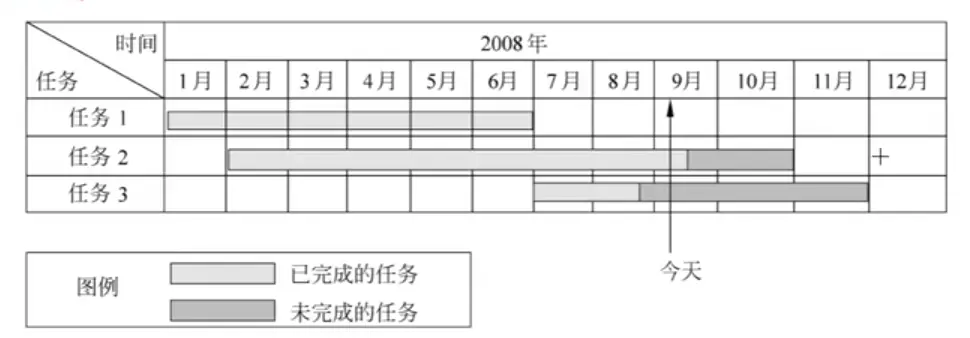
Gantt charts are great for seeing when tasks start/stop and what’s running in parallel. However, they don’t show dependencies well and make it hard to spot the “critical path.”
PERT Charts
A PERT chart is a directed graph where arrows represent tasks (labeled with duration) and nodes represent events. A node (event) only happens when all incoming tasks are finished; only then can outgoing tasks start. Events don’t consume time; they are just points in time.
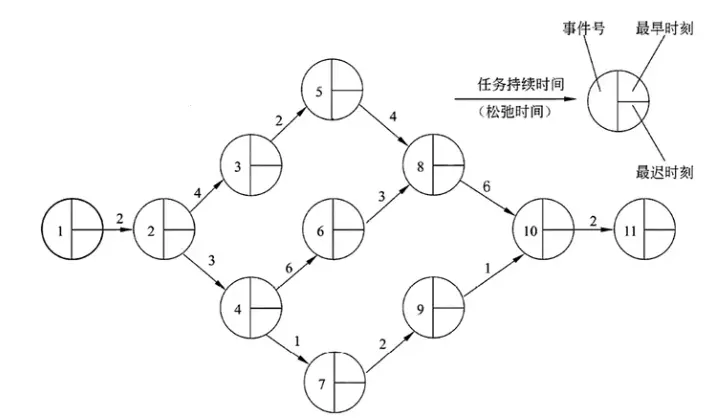
Each event has an “earliest time” (when tasks can start) and a “latest time” (when tasks must start to avoid delays). The difference is “Slack Time.”
PERT charts show dependencies and the critical path. They help identify which tasks can be delayed without hitting the final deadline. However, they aren’t great at showing parallelism at a glance.
Software Configuration Management (SCM)
SCM goals: Change identification, change control, version control, ensuring changes are implemented correctly, and change reporting.
Content includes: Version management, configuration support, change support, process support, team support, reporting, and auditing.
Databases (Repositories) in SCM:
- Development Library: For devs. Frequent changes, loose control.
- Controlled Library (Master Library): Stores baseline products at the end of a stage. This is where SCM happens.
- Product Library: Final products after system testing, ready for delivery or installation.
Risk Management
Software risk has two attributes: Uncertainty and Loss. Uncertainty means it might happen; Loss means it sucks if it does. You need to quantify both.
Project Risks threaten the plan. If they happen, schedules slip and costs rise. Think budget, people, resources, and requirements issues.
Technical Risks threaten quality and delivery. If these hit, the work gets hard or impossible. Think design, implementation, and interface issues, or using “bleeding edge” tech that isn’t ready.
Business Risks threaten the viability of the software. Top 5:
- Market Risk: Building a great product nobody wants.
- Strategic Risk: Product doesn’t fit the company’s direction anymore.
- Sales Risk: Sales team doesn’t know how to sell it.
- Management Risk: Losing senior management support.
- Budget Risk: Losing funding or people.
1. Risk Identification
This is about systematically spotting threats to the plan. Once you find known and predictable risks, you try to avoid them or control them.
One method is a Risk Item Checklist, focusing on:
- Product Size: Risks related to the overall scale.
- Business Impact: Constraints from management or the market.
- Customer Characteristics: Customer sophistication and communication.
- Process Definition: How well the team follows the software process.
- Development Environment: Quality/availability of tools.
- Technology: Complexity and “newness” of the tech.
- Staff Talent/Experience: Skills and experience of the engineers.
You can also categorize risks by Performance, Cost, Support, and Schedule.
2. Risk Prediction (Estimation)
This assesses two things: the probability it will happen and the consequences if it does.
(1) Activities
- Define a scale for probability.
- Describe the consequences.
- Estimate the impact on the project/product.
- Note the overall accuracy of the prediction.
A Risk Table is a simple tool here. List risks, categories, probability, and impact (1: Catastrophic, 2: Critical, 3: Marginal, 4: Negligible).
(2) Assessing Impact
Impact depends on Nature, Scope, and Timing.
- Nature: The type of problem (e.g., bad hardware interface).
- Scope: How bad is it and how much of the project is affected?
- Timing: When does it hit and for how long?
Risk Exposure (RE) calculation:
3. Risk Assessment
Uses a triplet:
You define Risk Referent Levels (usually cost, schedule, and performance). There’s a threshold where the project might be terminated if exceeded.
Steps:
- Define referent levels.
- Link each triplet to these levels.
- Predict termination points.
- Predict which combination of risks will trigger those points.
4. Risk Control
The goal is to have a strategy.
(1) Risk Mitigation (Avoidance)
The best way to handle risk is to stop it before it starts. Example: Risk $r_i$ is “High Staff Turnover.” If $l_i$ is 70% and $x_i$ is 2 (Critical), you:
- Discuss causes (pay, environment) with staff.
- Fix controllable causes before the project starts.
- Plan for continuity if someone leaves.
- Cross-train and share info across the team.
- Set standards so docs are always up to date.
- Peer review everything.
(2) Risk Monitoring
Watch for indicators that risk is increasing. For turnover, watch team morale, cohesion, and job market trends.
(3) RMMM Plan
All this goes into the Risk Mitigation, Monitoring, and Management (RMMM) plan. It documents the analysis and is used by the manager throughout the project.
Once the project starts, you monitor to see if risks happen, ensure mitigation steps are followed, and collect data for future projects. Often, one problem is caused by multiple risks, so tracking helps find the “root cause.”